Problem
In many situations, I’ve found myself needing to create many graphs that are identical except for things like the variables displayed and the titles. Writing out the definitions of the graphs over and over, changing only one or two variables in the process, creates a very long and difficult to manage document. It is highly redundant code and becomes difficult to maintain if one wants to make a tweak to the look of all the graphs. All of this mess can be avoided by defining such graphs as a function.
Solution
Using the embrace operator {{}} available since rlang 0.4.0 turning ggplot graphs into functions is pretty straight forward.
It is possible to use the embrace operator as an argument for column names and labels defined within functions.
scatter_plot <- function(data, x, y, title) {
  ggplot(data, aes({{x}}, {{y}})) +
    geom_point()+
    labs(title= {{title}})
}scatter_plot(mtcars, wt, qsec, "Wt by qsec")
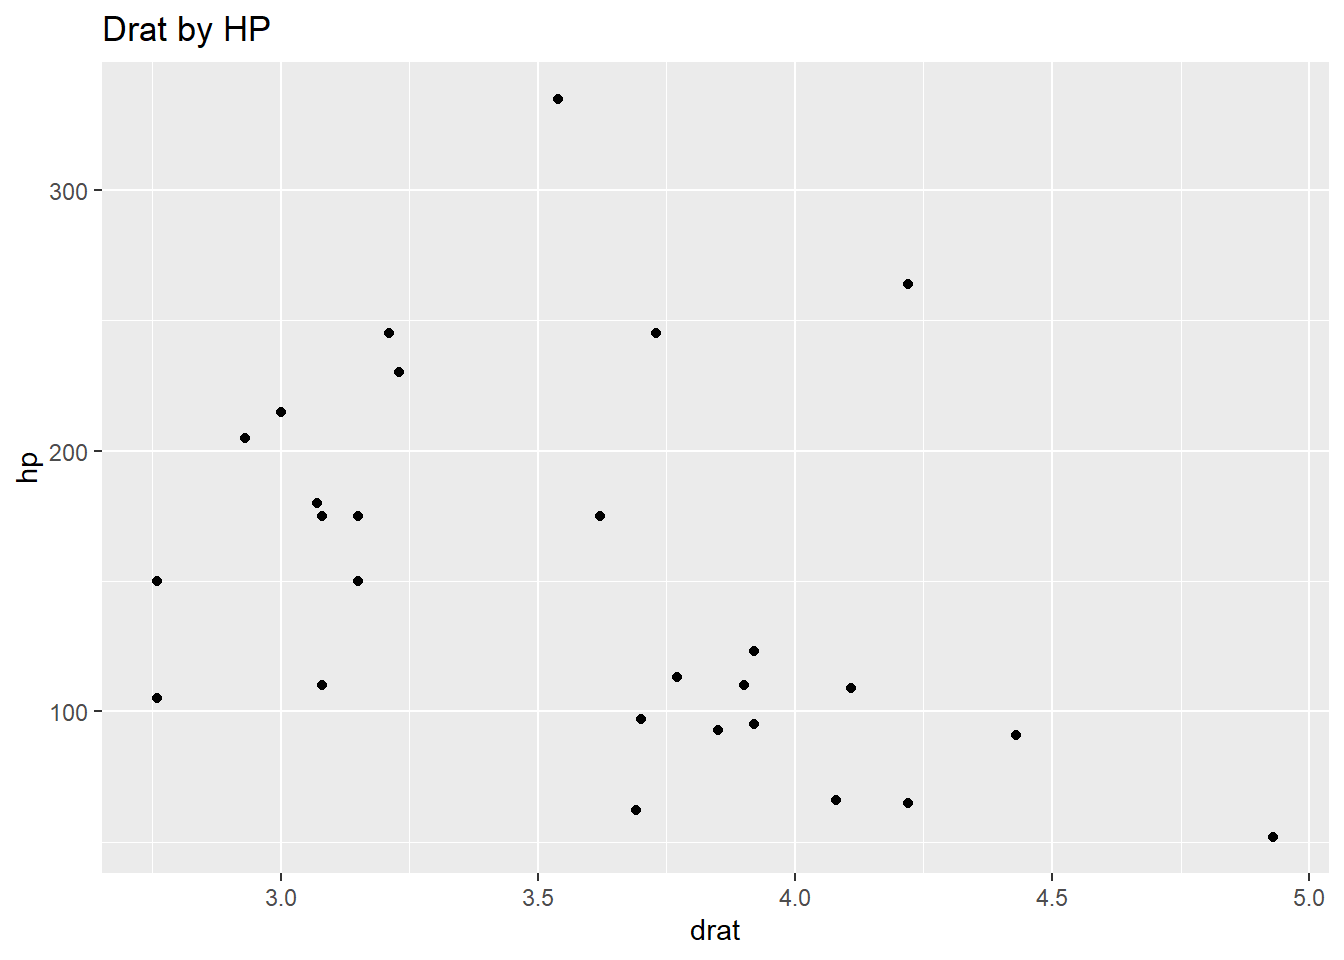
scatter_plot(mtcars, drat, hp, "Drat by HP")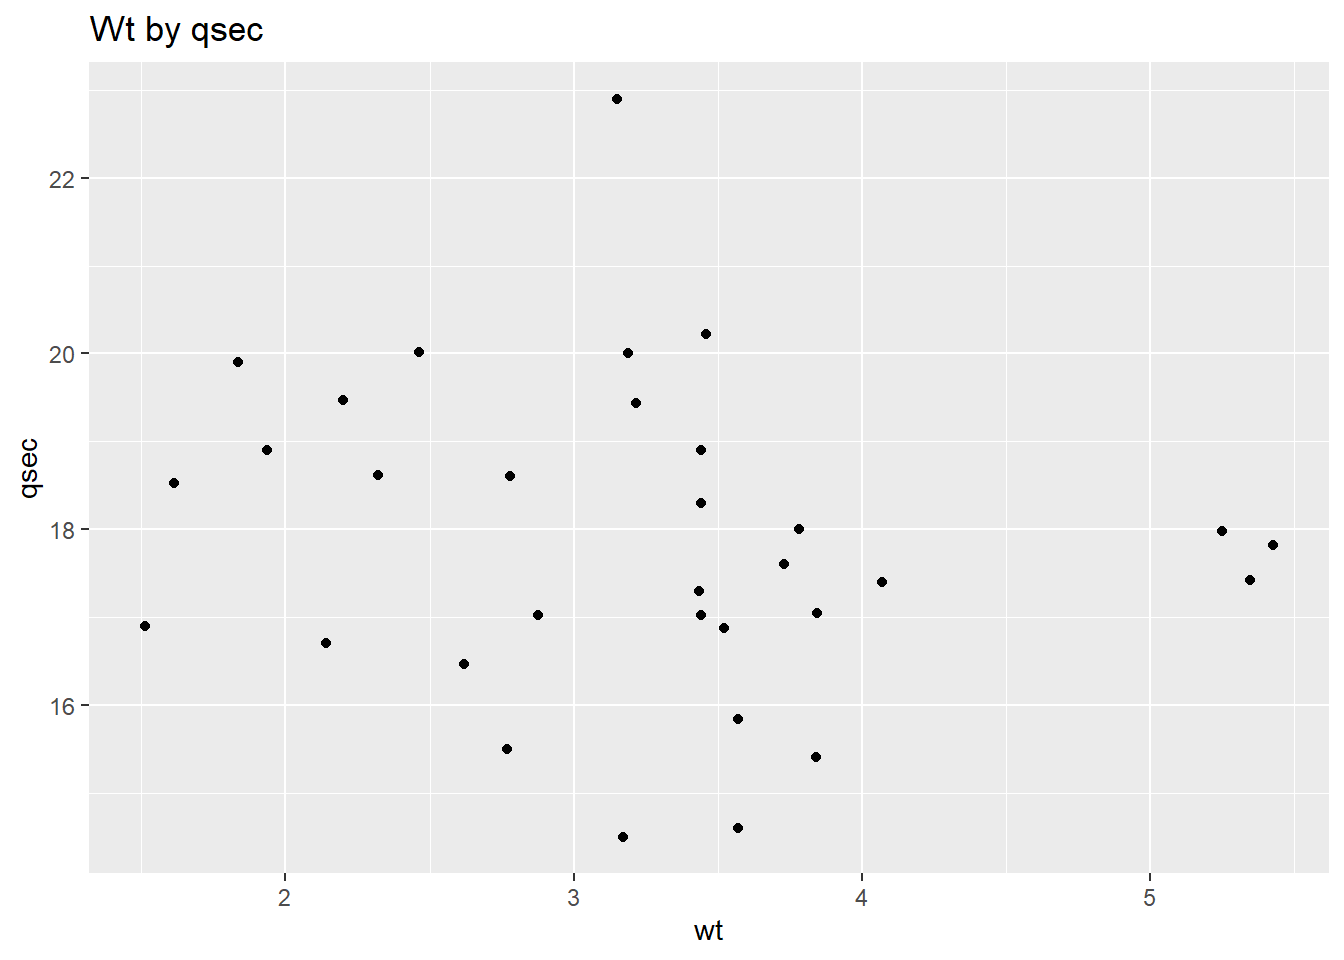
Plots can be customized like any ggplot object.
scatter_plot(mtcars, drat, hp, "Drat by HP with trend") +
  geom_smooth()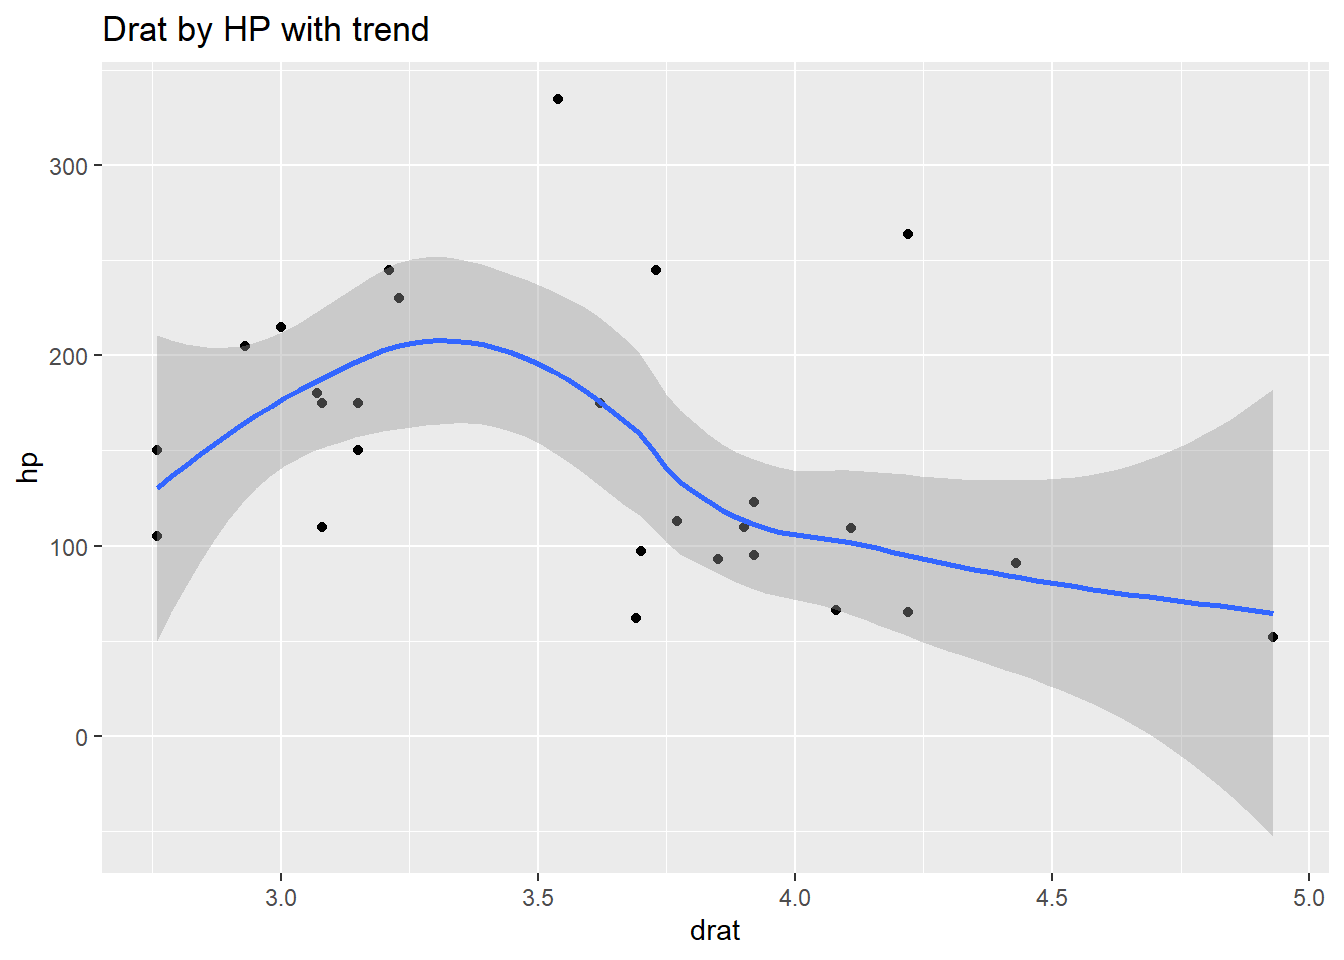
See Also
Citation
@online{craig2023,
  author = {Craig, Nathan},
  title = {`Ggplot` {Graphs} as {Functions}},
  date = {2023-09-29},
  url = {https://ncraig.netlify.app/posts/2023-09-29-ggplot-functions/index.html},
  langid = {en}
}