COVID-19 Cases in ICE Detention Over Time
The following maps and graph are generated with data scraped from the ICE Guidance on COVID-19 website. The scraped data are maintained in a GitHub repository. COVID-19 data reported by ICE are linked with geocoded facility locations. COVID-19 data are assembled in “long” format, plotted with ggplot (Wickham et al. 2024), and animated with the gganimate (Pedersen and Robinson 2024) library.
Cumulative COVID-19 Map
A map of cumulative COVID-19 cases by ICE detention facility over time.
Cumulative COVID-19 Line Plot
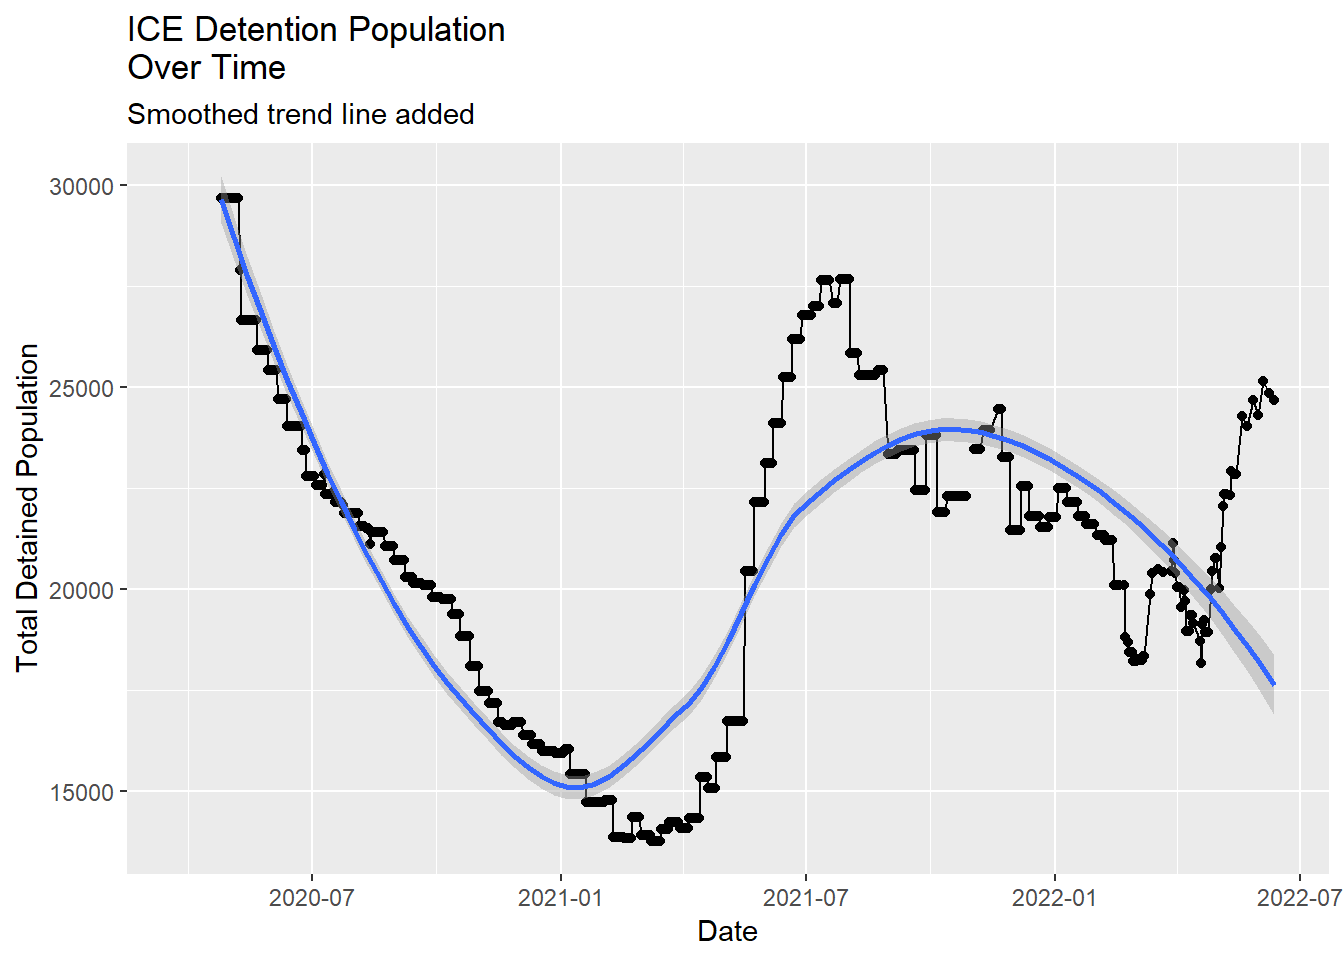
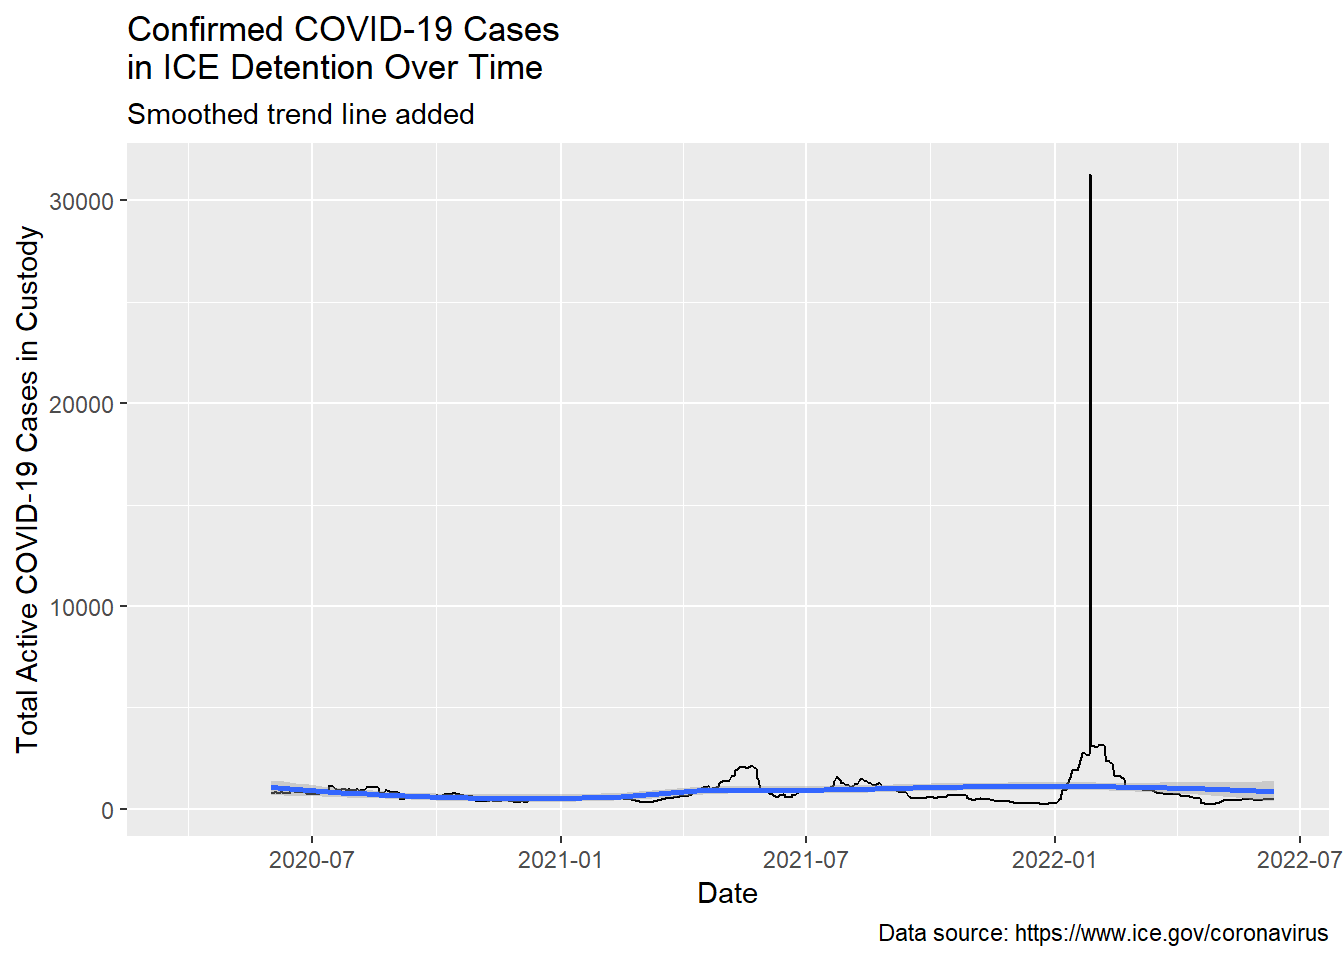
Total Detained and Active Cases Line Plot Over Time
The following is a pair of line plots showing detained population and active COVID-19 cases in custody over time. Comparing the plots one can see that between July and January 2020 as the detained population decreased the number of active COVID-19 cases in custody declined. Likewise, one can see that in late March 2021 as the total detained population began to rise the number of active COVID-19 cases in custody also rose and that by April 2021 both the detained population and active COVID-19 cases in ICE detention are rising rapidly.
Active COVID-19 Map
A map of active COVID-19 cases by ICE detention facility over time.
References
Citation
@online{craig2021,
  author = {Craig, Nathan},
  title = {ICE {Detention} {COVID-19} {Maps}},
  date = {2021-05-23},
  url = {https://ncraig.netlify.app/posts/2021-05-23-ice-detention-covid-19-maps/index.html},
  langid = {en}
}