Introduction
The Global Database of Events, Language, and Tone (GDELT) is a big data project created by Dr. Kalev Leetaru and others. Among the many intriguing tools offered by GDELT the Television Database Explorer and API is noteworthy. Learning to use GDELT data can be a daunting experience, and I am definitely learning as I go. This page attempts to report some things I learned while digging into the Television Explorer that I believe others might find useful. A key purpose of this document is to review methods for directly accessing the API within R for use in R Markdown. First, I a brief mention of why an anthropologist might be interested in a TV News database. Then we will get into the “how of it”, but feel free to jump ahead.
Media: Imagined communities and moral panics
In May of 2021, as part of an exercise of thinking through and responding to an article by Adam Harris (2021) I read in The Atlantic Monthly, I used GDELT along with the GDELT Global Online News Coverage and the Google Ngram Viewer to discuss a major uptick in news coverage of Critical Race Theory (CRT). GDELT allowed me to track TV coverage, the Global Online News Coverage gave a sense of tone, and the Google Ngram viewer gave a frequency chart with the longest temporal coverage. Intriguingly, Dr. Leetaru (Leetaru 2021b, 2021a) included Critical Race Theory in brief news summaries from June 6 and another from November 10 of 2021. Apparently, he noticed a spike in coverage of this topic too. The production of media is a process, but the intensity of news coverage of CRT seems to have emerged somewhat as an event in society (Sewell 1996).
To have a better sense of this news event, I wanted to see when there was greater coverage over time and get a sense of the increased amplitude of coverage of CRT in 2021. I attempted to contextualize the various news coverage spikes to other contemporaneous processes: Dr. Bell’s death, the nomination of Lani Guinier, Breitbart’s publication of the Obama/Bell video, the murder of George Floyd, Chris Rufo’s appearance on Fox News, Trump’s signing EO 13950, and Biden’s swearing in.
I cast my foray into GDELT data, as an application of the “culturomics” (Michel et al. 2011; Leetaru 2011) approach which involves the distant reading (Schulz 2011; Moretti 2013) of large quantities of media. Print media is central to the creation of shared experiences that form the basis of “imagined communities” undergirding the nation state (Anderson 2006). If print media is key to creating a shared experience, then television (which is a richer and more immerse type of media than print) should also play a similar role in fostering shared experiences and views in contemporary society.
In addition to creating imagined communities, media can also play an important role in the creation and spread of moral panics (Cohen 2011a, 2011b; Critcher et al. 2013). In fact, media is a crucial ingredient in allowing moral panics to spread out of local contexts and can play a role in ranking the issue as among society’s most pressing. One might think about the creation and spread of moral panics as miniature “imagined communities” of outraged believers that operate within larger national identities.
Moral panic is manifest by: 1) collective action campaigns, 2) bills that criminalize the deviant behavior, 3) ranking of the issue high in the public’s hierarchy, 4) public discussion of the issue in the media (Goode and Ben-Yehuda 2009, 153).
GDELT is intriguing to me as an anthropologist because it represents a way to examine large bodies of a type of complex media that permeates our lives. This stream of broadcast TV news contribute to mediascapes which foster particular ideoscapes (Appadurai 1990, 296).
Using tools like GDELT or Google Ngram Viewer, we can examine these macro “scapes” of media and ideology to start to systematically track what as a society are we being presented, when, for how long, and at what intensity? I think there is quite a bit more to consider in regards to media coverage of CRT. However here in this “how to”, I want to discuss some things I learned about retrieval of GDELT TV data while trying to understand TV news coverage of CRT.
Application Programming Interfaces (API’s) for reproducable and updateable research
API’s are a good way to access data in the spirit of reproducible research (Stodden, Leisch, and Peng 2014), particularly when the data are regularly updated like GDELT. In the past, I used the Television Explorer interface, downloaded a CSV file, and worked with it on my hard drive. While I was grateful for the data, this method involved doing analysis on a static file. I would rather access the API directly, pull in the comma delimited data, and make a data frame for further processing all programmatically within an R Markdown document. Moreover, I want that request and data frame output to be able to run at some point again in the future–perhaps even updated programmatically.
I encountered three ways of communicating with the GDELT API inside R. Each has its own strengths and weaknesses. The three ways are:
-
reader::read_csvpermits finer control over parameters but takes some setting up. Though it involves manually editing long URLs, I findread_csvthe preferred method of the three. -
newsflash::query_tvis the simplest and fastest method. If monthly resolution data are suitable this may be a turnkey solution for some applications. -
httrandjsonlitewill pull the data in JSON format with lots of ancillary information. I can also get back results from a CSV request. However, pulling out the desired product looks a bit daunting. Compared toread_csv, thehttrandjsonlitemethod seem to involve several unnecessary steps.
Below I illustrate each of these three methods discussing the strengths and weaknesses. I focus on read_csv() because I believe it the best method for my purposes. Let’s call our libraries and get into it.
“Code chunks” (blocks of code) are folded by default. In these cases, clicking “Show Code” will reveal the underlying R commands. Some chunks are set to always display code, these are generally chunks illustrating a concept under discussion in the text.
CSV API request to readr::read_csv()
One of the GDELT 2.0 TV News API’s six output formats is CSV. When an API request is made with format=csv the browser returns a CSV file. Therefore, a properly constructed GDELT TV News API request URL can be passed directly to read_csv() and the function will create a data frame. It is super simple, really that’s it. Let’s look at how to construct a request URL using the Explorer GUI and show how to set the output format to CSV. Then we’ll be ready to drop that URL into a read_csv() call.
Determining the API request parameters
GDELT 2.0 TV News API has a fair number of options; some really must be understood to proceed forward. The Explorer Summary search page is broken into a series of steps. I walk through these and discuss each in turn.
Step 1: Dataset
The Explorer GUI lets users choose among 5 different data sets:
- Global Online News Coverage: Online textual news sources along with some images.
- Television News (Internet Archive): Full text search of complete raw closed captioning stream. See more here.
- Television News AI (Internet Archive): Searches on visual entities, caption entities, automated speech recognition (ASR), caption keywords, and OCR of onscreen text. See more here.
- Chyron Explorer (Internet Archive): Search the Internet Archive’s “Third Eye” OCR stream.
- Chyron Browser: Visual summaries of chyron text overlays for a specified date.
Once the desired data set is selected, the Explorer GUI refreshes and the search fields change. Though the API request structure is similar across the five data sets, each is slightly different because the data being queried are either from different news sources (written, TV closed captions, TV chyrons) or are the same data sources processed in different ways (TV closed captions vs. AI). Knowing which data set one is working with is a key step to successfully using the Explorer GUI and getting a properly structured request URL. Here I discuss parameters related to the TV News data set.

To the far right, in the section where it says “Enter Search” there is an blue “i” info button. Clicking this reveals hidden text that explains more about the data structure and how to construct searches. Each parameter has its own info button. Reading these entries carefully and consulting them frequently is useful for grasping the details of the search process.
The “i” buttons may not work properly in Firefox. They work in Chrome.
Step 2: Output Type
One must choose to display results of a single query as a “Summery Overview Dashboard” or a comparison of multiple queries as a “Comparison Visualization.” Both types of output are useful and work in similar ways. Here, I discuss single query “Summery Overview Dashboard” results.
Step 3: Enter Search
Many big decisions are made in this section including the search term and several important parameters. Below are some thoughts on the search syntax and key parameters for the TV News data set:
-
Keyword: This is the most complex field and is where the search term is constructed. Be sure to read the blue info button. There is also a tutorial video that walks through some more complex search examples. Below are some search syntax rules:
- Only exact keywords are matched. Eg. a search on
russiawill not return results for “russian” or “russians”. - Groups of OR’d terms can be enclosed in parentheses. Eg.
(russia OR russian OR russians)searches all three terms. - Phrases are enclosed in quotes and may be as long as five terms. Eg.
"critical race theory" - Place a
-in front of terms or phrases to exclude these from searches. Eg.education -"critical race theory"returns clips containing education that do not also mention “critical race theory”. - Search terms are not translated. Therefore, words are language specific.
- It is possible to search for terms that might be in adjacent 15 second clips using the context operator. Eg.
clinton (context:"email" OR context:"emails" OR context:"server")returns all clips that contain clinton and which also contain either “email,” “emails,” or “server” either in the same or adjacent clips.
- Only exact keywords are matched. Eg. a search on
Time Period: I generally request the entire time period. It can be filtered later in R.
Stations: This defaults to CNN, Fox, and MSNBC. For US news, I select all of the stations listed under
Active National. There is also an optionalmarketparameter that one can use, but calling it involves manually deleting the stations and replacing them withmarket=national. I am not aware of a way to do this via the GUI.Combine/Separate: One must choose whether values are Separate Stations with Multiple Timelines or Combine Stations for a Single Timeline. I am often interested in comparing values between stations and thus select Separate Stations for Multiple Timelines. If one is interested in the total volume of coverage on a given topic, then select Combine Stations to generate a Single Timeline. One can even envision a scenario where the same term might be searched both combined and single to see what portion of total coverage each individual station is responsible for.
Normalized: If the plan is to make comparisons between stations or search terms, the data should be normalized.
Date Resolution: Here one can set the units of time for which data are reported. If Time Period <7 days the Date Resolution defaults to hourly. If Time Period <3 years the Default Date resolution is daily, and when Time Period >3 years the default Date Resolution is monthly. These defaults can be overridden. I generally request daily resolution.
Time Zone: The default is UTC. I personally do not change this, and believe it only has relevance when working with hourly Date Resolution data.
Smoothing: The default is No Smoothing. I personally do not change this.
Step 4: Displays
Since the aim here is to obtain a data frame, the display parameters might not seem that important. However, by turning these settings on one can get a quick check on the search and also have a fuller sense of what was returned. For example, it can be informative to watch a couple of clips or review some of the visualizations. I recommend including zoomable timelines and including all displays possible. Note that for me the Google Trends Timeline does not function so I often turn it off.
Getting the link
Once search parameters are determined it is time to generate an export URL. Below are the steps I use to get a request URL to pass to read_csv:
- Using the GDELT Summary Explorer GUI set the search terms and execute a search. This returns a web page in a new browser tab. Eg. Here is the search summary for “critical race theory”.
- Check the results page noting the “Data Source” and “Human Summary” fields to confirm that the desired search was submitted. If the search is not correct, modify and resubmit.

- If the desired search was submitted, then copy the URL to a text document for future use. This is the permanent URL for this particular search and should be used when communicating results. Dr. Leetaru uses links to the summary page as a reference when writing on the web. I follow that convention.
- In the search results that are returned in the new page, find the “Export” hamburger menu and select “Save data as JSON”. This selection also returns a new web page in a new tab.

- In that new tab, copy the URL and paste it into a text document (like an R Markdown file).
- Change the format variable of the URL from
format=jsontoformat=csv. - Once the format parameter is changed, paste the modified URL into a
read_csv()call. This will return the desired CSV file, which is read withread_csv(), and can be assigned to a variable likedf. - It is also useful to copy the exact search terms that were used and assign these to a variable to be included in reports or graphs.
The examples below use an export URL with read_csv to create a data frame which is then passed to ggplot.
In the code chunks, please forgive the long API URLs that neither scroll nor wrap. This is a persistent issue for which I found no clear resolution shy of breaking up the URL which is obviously undesirable. The cleanest method I envisioned to make the URL available is to put it in a link. Request URL’s are supplied in a link to the right of the data frame.
In the code chunk below, please notice the use of double quotes in the search_term variable. In R, strings are created under either single or double quotes, there is no difference. If the string contains " then in R it is generally recommended to use ' for the outer quotes. I follow this convention. In doing this while working with the Explorer GUI, it is possible to copy the search directly from the box and place that whole term in single quotes.


# paste in the text from the GUI search box.
# note that entire string should be contained in single quotes
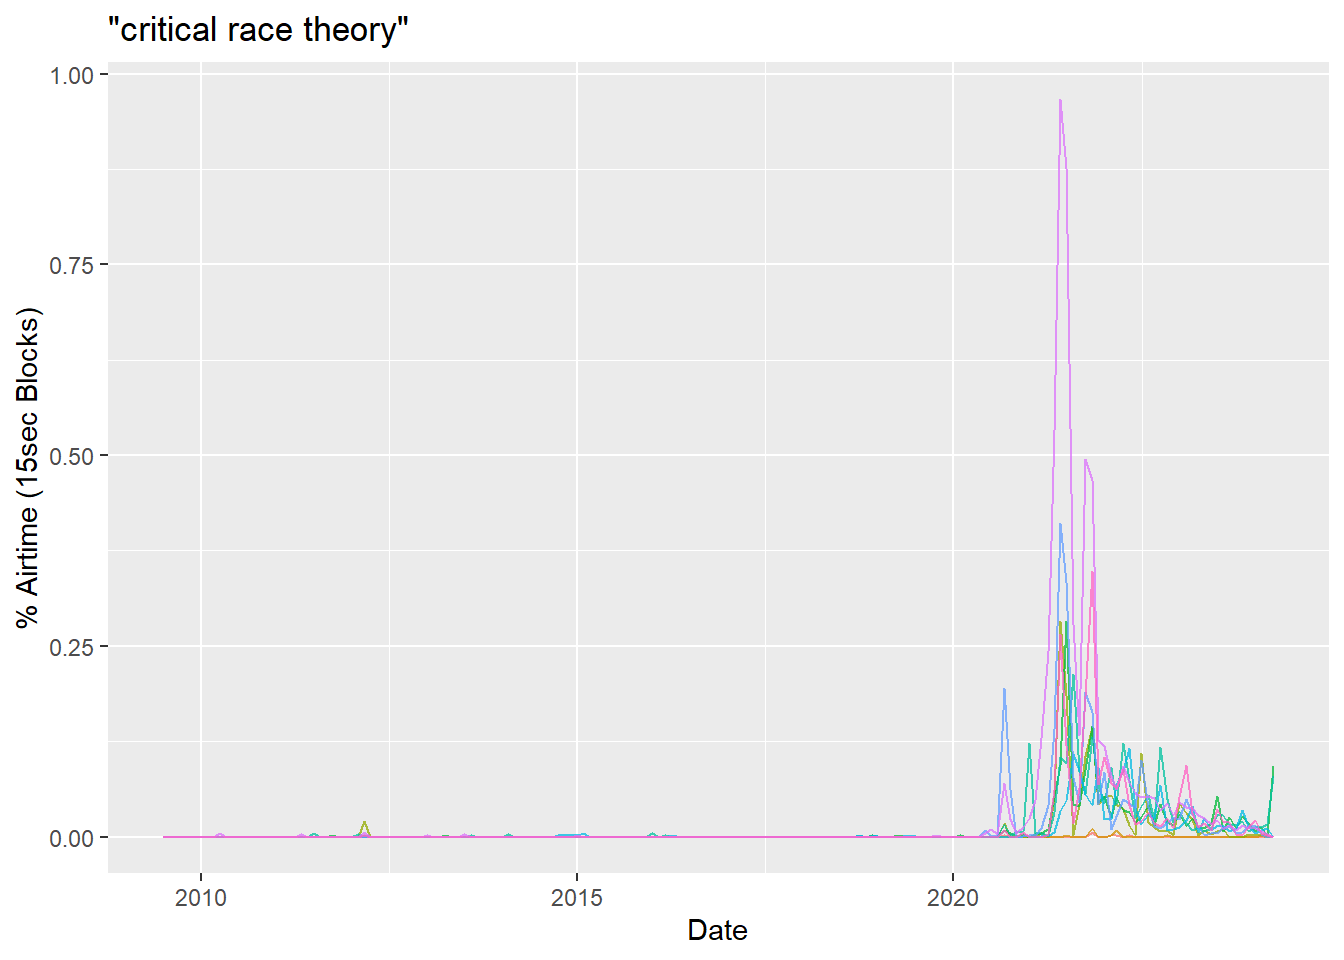
search_term <- '"critical race theory"'
# Paste the request URL into a read_csv call and assign to variable
df <- read_csv("https://api.gdeltproject.org/api/v2/tv/tv?format=csv×pan=FULL&last24=yes&dateres=DAY&query=%22critical%20race%20theory%22%20(station:BLOOMBERG%20OR%20station:CNBC%20OR%20station:CNN%20OR%20station:CSPAN%20OR%20station:CSPAN2%20OR%20station:CSPAN3%20OR%20station:FBC%20OR%20station:FOXNEWS%20OR%20station:MSNBC%20)%20&mode=timelinevol&timezoom=yes") %>%
rename(date = 1,
network = 2,
value = 3) %>%
mutate(search = search_term)
df# A tibble: 48,762 × 4
date network value search
<date> <chr> <dbl> <chr>
1 2009-06-05 BLOOMBERG 0 "\"critical race theory\""
2 2009-06-06 BLOOMBERG 0 "\"critical race theory\""
3 2009-06-07 BLOOMBERG 0 "\"critical race theory\""
4 2009-06-08 BLOOMBERG 0 "\"critical race theory\""
5 2009-06-09 BLOOMBERG 0 "\"critical race theory\""
6 2009-06-10 BLOOMBERG 0 "\"critical race theory\""
7 2009-06-11 BLOOMBERG 0 "\"critical race theory\""
8 2009-06-12 BLOOMBERG 0 "\"critical race theory\""
9 2009-06-13 BLOOMBERG 0 "\"critical race theory\""
10 2009-06-14 BLOOMBERG 0 "\"critical race theory\""
# ℹ 48,752 more rowsCopy request URL.
df %>%
  ggplot(aes(date, value, color=network))+
  geom_line(alpha = 0.75)+
  labs(title = paste("TV Volume Timeline:", search_term),
     subtitle = "Coverage Volume Normalized Daily Resolution",
     caption = "Data Source: https://api.gdeltproject.org/api/v2/summary/summary",
     color = "Network")+
xlab("Date")+
ylab("% Airtime (15sec Blocks)")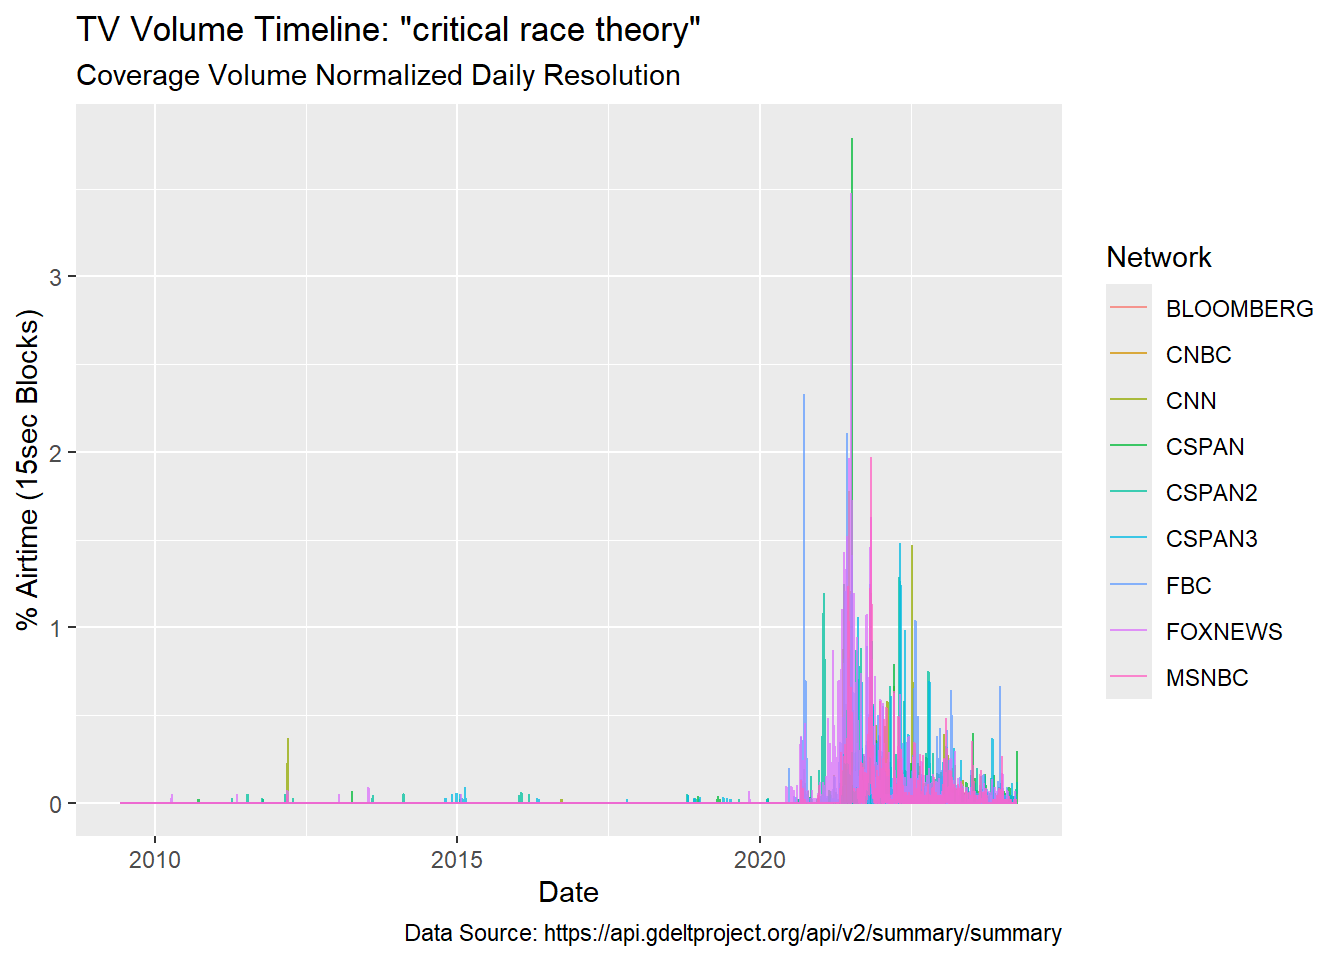
read_csv.Complex Searches
Below is an example illustrating a complex multi-term search on Critical Race Theory looking only at contexts where “school”, “education”, “classroom”, and “school board” were not mentioned. One can see that the overall structure is similar to the prior figure but the amplitude of the highest peak is lower once some education related terms are used to constrain the search. This change in amplitude illustrates that a portion of the conversation around CRT is related to education.
df %>%
  ggplot(aes(date, value, color=network))+
  geom_line(alpha = 0.75)+
  labs(title = paste("TV Volume Timeline:", search_term),
     subtitle = "Coverage Volume Normalized Daily Resolution",
     caption = "Data Source: https://api.gdeltproject.org/api/v2/summary/summary",
     color = "Network")+
xlab("Date")+
ylab("% Airtime (15sec Blocks)")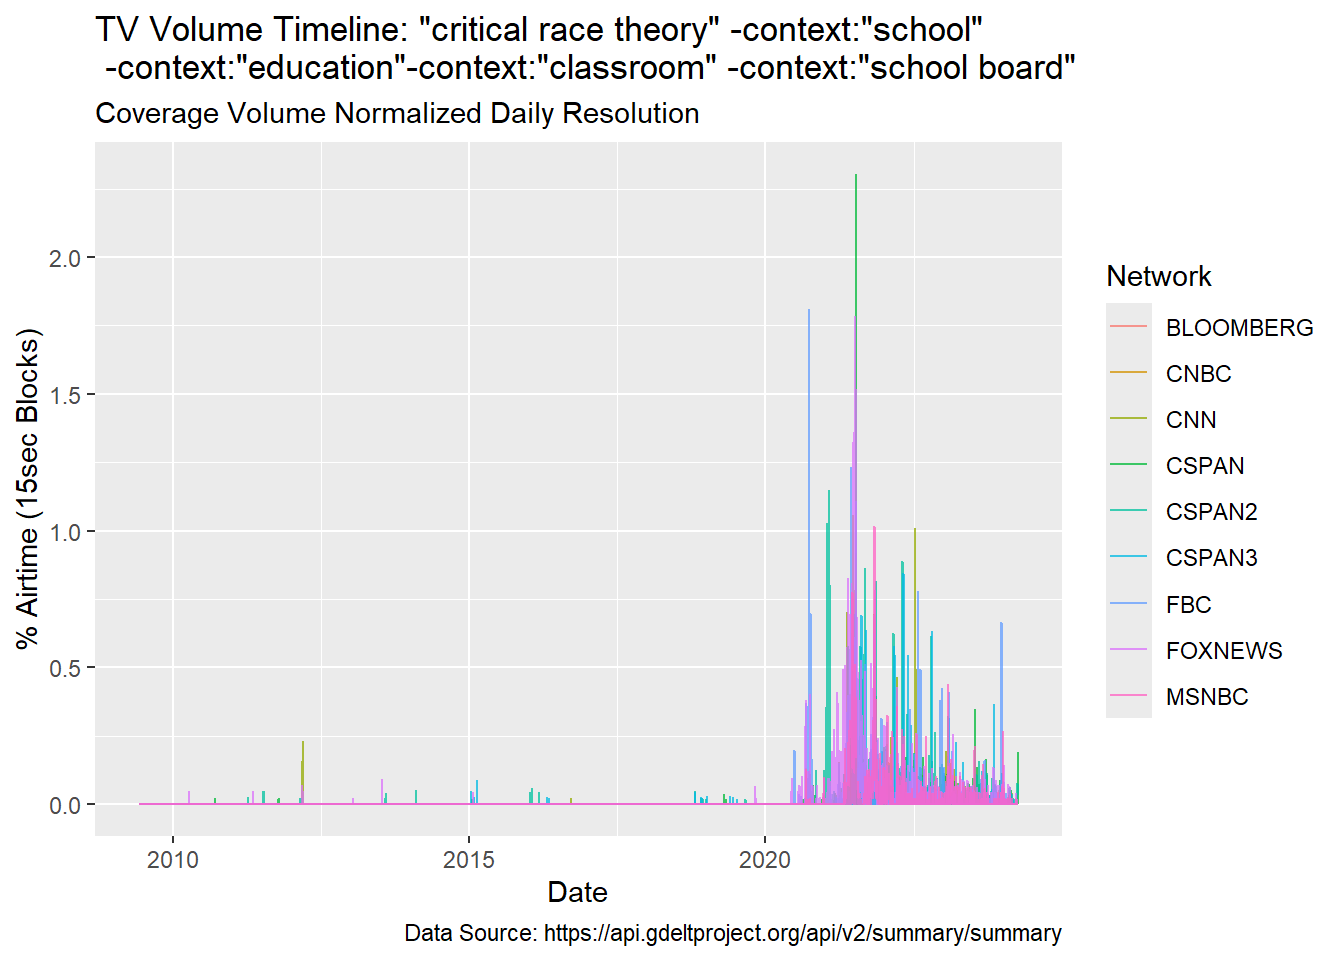
read_csv.Search Comparisons
If at Step 3 one selects “Comparison Visualization” it is possible to compare multiple search results. To serve as an example, it is possible to plot mentions of “Critical Race Theory” in comparison to a search regarding the combined mentions of “evolution”, “evolutionary theory”, or “natural selection”. What one finds is that at the peak of CRT coverage it was mentioned more frequently than all other terms combined. Unfortunately, at this time the Summary Explorer GUI does not have an option to export JSON and I’m not presently sure how to construct the request URL.
Search Comparison Fiddling (NOT PUBLISHED)
For any search, like “critical race theory” one can return a wordcloud and list of most common terms from the 200 most relevant matching clips. At the bottom right of the wordcloud, there is a direct link to a CSV of the common terms. One can see that after removing the search terms (i.e. “Race”, “Theory”, and “Critical”) four of the top five words relate to an educational setting: “School”, “Schools”, “Taught”, and “Parents”. Reviewing the 100 most frequent words, I made a list of terms related to the educational situation. We can call this a theme dictionary because it is a dictionary of terms related to our theme, which in this case is education. The theme dictionary can be used to perform a NOT filter on the main search term thereby returning clips where none of the theme dictionary terms are mentioned. Comparing the two provides a way to track the portion of coverage of a given query as it relates to a specific theme.
search_term <- '"critical race theory"'
df <- read_csv("https://api.gdeltproject.org/api/v2/tv/tv?format=csv×pan=FULL&last24=yes&dateres=DAY&query=%22critical%20race%20theory%22%20(station:BLOOMBERG%20OR%20station:CNBC%20OR%20station:CNN%20OR%20station:CSPAN%20OR%20station:CSPAN2%20OR%20station:CSPAN3%20OR%20station:FBC%20OR%20station:FOXNEWS%20OR%20station:MSNBC%20)%20&mode=wordcloud")Rows: 371 Columns: 2
── Column specification ────────────────────────────────────────────────────────
Delimiter: ","
chr (1): Label
dbl (1): Count
ℹ Use `spec()` to retrieve the full column specification for this data.
ℹ Specify the column types or set `show_col_types = FALSE` to quiet this message.df# A tibble: 371 × 2
Label Count
<chr> <dbl>
1 Race 100
2 Theory 96.1
3 Critical 92.7
4 Taught 12.6
5 Schools 11.0
6 Don 10.6
7 School 10.4
8 America 9.63
9 Country 9.04
10 Talking 8.64
# ℹ 361 more rowsSearch with theme dictionary filtered out of the query “Critical Race Theory”.
search_term1 <- '"critical race theory"'
df_1 <- read_csv("https://api.gdeltproject.org/api/v2/tv/tv?format=csv×pan=FULL&last24=yes&query=%22Critical%20Race%20Theory%22%20(station:BLOOMBERG%20OR%20station:CNBC%20OR%20station:CNN%20OR%20station:CSPAN%20OR%20station:CSPAN2%20OR%20station:CSPAN3%20OR%20station:FBC%20OR%20station:FOXNEWS%20OR%20station:MSNBC%20)%20&mode=timelinevol&timezoom=yes") %>%
rename(date = 1,
network = 2,
value = 3) %>%
mutate(search = search_term)Rows: 1611 Columns: 3
── Column specification ────────────────────────────────────────────────────────
Delimiter: ","
chr (2): Date (Monthly +00:00: 06/05/2009 - 04/04/2024), Series
dbl (1): Value
ℹ Use `spec()` to retrieve the full column specification for this data.
ℹ Specify the column types or set `show_col_types = FALSE` to quiet this message.df_1# A tibble: 1,611 × 4
date network value search
<chr> <chr> <dbl> <chr>
1 6/2009 BLOOMBERG 0 "\"critical race theory\""
2 7/2009 BLOOMBERG 0 "\"critical race theory\""
3 8/2009 BLOOMBERG 0 "\"critical race theory\""
4 9/2009 BLOOMBERG 0 "\"critical race theory\""
5 10/2009 BLOOMBERG 0 "\"critical race theory\""
6 11/2009 BLOOMBERG 0 "\"critical race theory\""
7 12/2009 BLOOMBERG 0 "\"critical race theory\""
8 1/2010 BLOOMBERG 0 "\"critical race theory\""
9 2/2010 BLOOMBERG 0 "\"critical race theory\""
10 3/2010 BLOOMBERG 0 "\"critical race theory\""
# ℹ 1,601 more rowssearch_term2 <- '"Critical Race Theory" -School -Schools -Taught -Parents -Teach -Teaching -Teachers -Children -Education -Kids -Students -Professor -Curriculum'
df_2 <- read_csv("https://api.gdeltproject.org/api/v2/tv/tv?format=csv×pan=FULL&last24=yes&query=%22Critical%20Race%20Theory%22%20-School%20-Schools%20-Taught%20-Parents%20-Teach%20-Teaching%20-Teachers%20-Children%20-Education%20-Kids%20-Students%20-Professor%20-Curriculum%20(station:BLOOMBERG%20OR%20station:CNBC%20OR%20station:CNN%20OR%20station:CSPAN%20OR%20station:CSPAN2%20OR%20station:CSPAN3%20OR%20station:FBC%20OR%20station:FOXNEWS%20OR%20station:MSNBC%20)%20&mode=timelinevol&timezoom=yes") %>%
rename(date = 1,
network = 2,
value = 3) %>%
mutate(search = search_term)Rows: 1611 Columns: 3
── Column specification ────────────────────────────────────────────────────────
Delimiter: ","
chr (2): Date (Monthly +00:00: 06/05/2009 - 04/04/2024), Series
dbl (1): Value
ℹ Use `spec()` to retrieve the full column specification for this data.
ℹ Specify the column types or set `show_col_types = FALSE` to quiet this message.df_2# A tibble: 1,611 × 4
date network value search
<chr> <chr> <dbl> <chr>
1 6/2009 BLOOMBERG 0 "\"critical race theory\""
2 7/2009 BLOOMBERG 0 "\"critical race theory\""
3 8/2009 BLOOMBERG 0 "\"critical race theory\""
4 9/2009 BLOOMBERG 0 "\"critical race theory\""
5 10/2009 BLOOMBERG 0 "\"critical race theory\""
6 11/2009 BLOOMBERG 0 "\"critical race theory\""
7 12/2009 BLOOMBERG 0 "\"critical race theory\""
8 1/2010 BLOOMBERG 0 "\"critical race theory\""
9 2/2010 BLOOMBERG 0 "\"critical race theory\""
10 3/2010 BLOOMBERG 0 "\"critical race theory\""
# ℹ 1,601 more rows# df <- df_crt %>% inner_join(df_edu, by = c("date", "network")) %>%
# rename(CRT = value.x) %>%
# rename(EDU = value.y) %>%
# select(c(-search.x, -search.y)) %>%
# pivot_longer(cols = c(CRT, EDU), names_to = "search", values_to="value")df_1 %>%
ggplot(aes(date, value, color=network))+
geom_line(alpha = 0.75)+
labs(title = paste("TV Volume Timeline:", search_term1),
subtitle = "Coverage Volume Normalized Daily Resolution",
caption = "Data Source: https://api.gdeltproject.org/api/v2/summary/summary",
color = "Network")+
xlab("Date")+
ylab("% Airtime (15sec Blocks)")`geom_line()`: Each group consists of only one observation.
ℹ Do you need to adjust the group aesthetic?
API Request with newsflash::query_tv
The query_tv function of the newsflash library provides a quick and easy way to access the Television Archive data set. I would like to learn more about building wrappers of this kind. While I’m very impressed by query_tv there are some matters to be aware of when using it.
Monthly Resolution
The query_tv function returns monthly results for the full time range of the data set. This is suitable resolution for many purposes. However, if one wants daily, or finer, resolution data then another method of submitting requests is required because query_tv does not seem to have arguments for date resolution.
Single Search Term
The query_tv only permits searching on a single term. This is equivalent to data displayed in and exportable from the Summary Overview Dashboard. Within query_tv I don’t see options for Comparison Visualization. If searches on a single query are all that is required query_tv may be appropriate, but it can’t handle query comparisons. However, at this point, I’m not sure how to construct a request URL for a Comparison Visualization and would need to build comparisons by merging individual queries. Therefore, query_tv’s single search limitation is pretty trivial.
# search_term <- params$search
search_term <- '"critical race theory"'

starting_date <- NULL

df <- query_tv(search_term,
               mode = "TimelineVol",
               start_date = starting_date) %>%
  tibble() %>%
  arrange(date) %>%
  # filter(network %in% c("CNBC","CNN", "CSPAN", "FOX News", "MSNBC")) %>%
  mutate(network = as.factor(network),
         search = search_term)
df
# A tibble: 1,602 × 4
network date value search
<fct> <dttm> <dbl> <chr>
1 Bloomberg 2009-07-01 12:00:00 0 "\"critical race theory\""
2 CNBC 2009-07-01 12:00:00 0 "\"critical race theory\""
3 CNN 2009-07-01 12:00:00 0 "\"critical race theory\""
4 CSPAN 2009-07-01 12:00:00 0 "\"critical race theory\""
5 CSPAN2 2009-07-01 12:00:00 0 "\"critical race theory\""
6 CSPAN3 2009-07-01 12:00:00 0 "\"critical race theory\""
7 FOX Business 2009-07-01 12:00:00 0 "\"critical race theory\""
8 FOX News 2009-07-01 12:00:00 0 "\"critical race theory\""
9 MSNBC 2009-07-01 12:00:00 0 "\"critical race theory\""
10 Bloomberg 2009-08-01 12:00:00 0 "\"critical race theory\""
# ℹ 1,592 more rowsdf %>%
ggplot(aes(date, value, color=network))+
geom_line(alpha = 0.75)+
labs(title = paste("TV Volume Timeline:", search_term),
subtitle = "Coverage Volume Normalized Monthly Resolution",
caption = "Data Source: https://api.gdeltproject.org/api/v2/summary/summary",
color = "Network")+
xlab("Date")+
ylab("% Airtime (15sec Blocks)")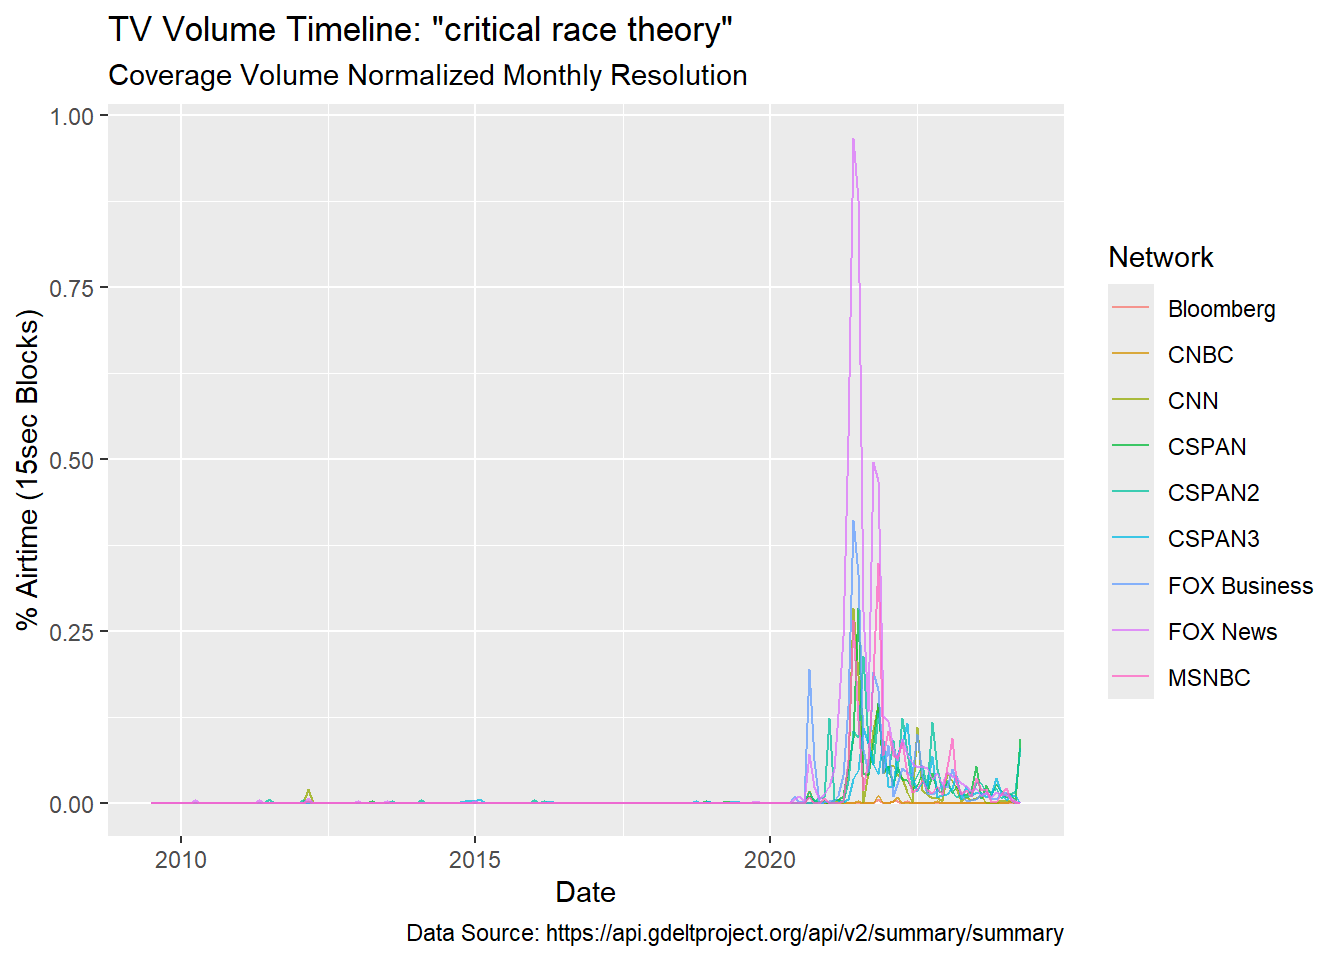
query_tv.Watch the Quotation Marks
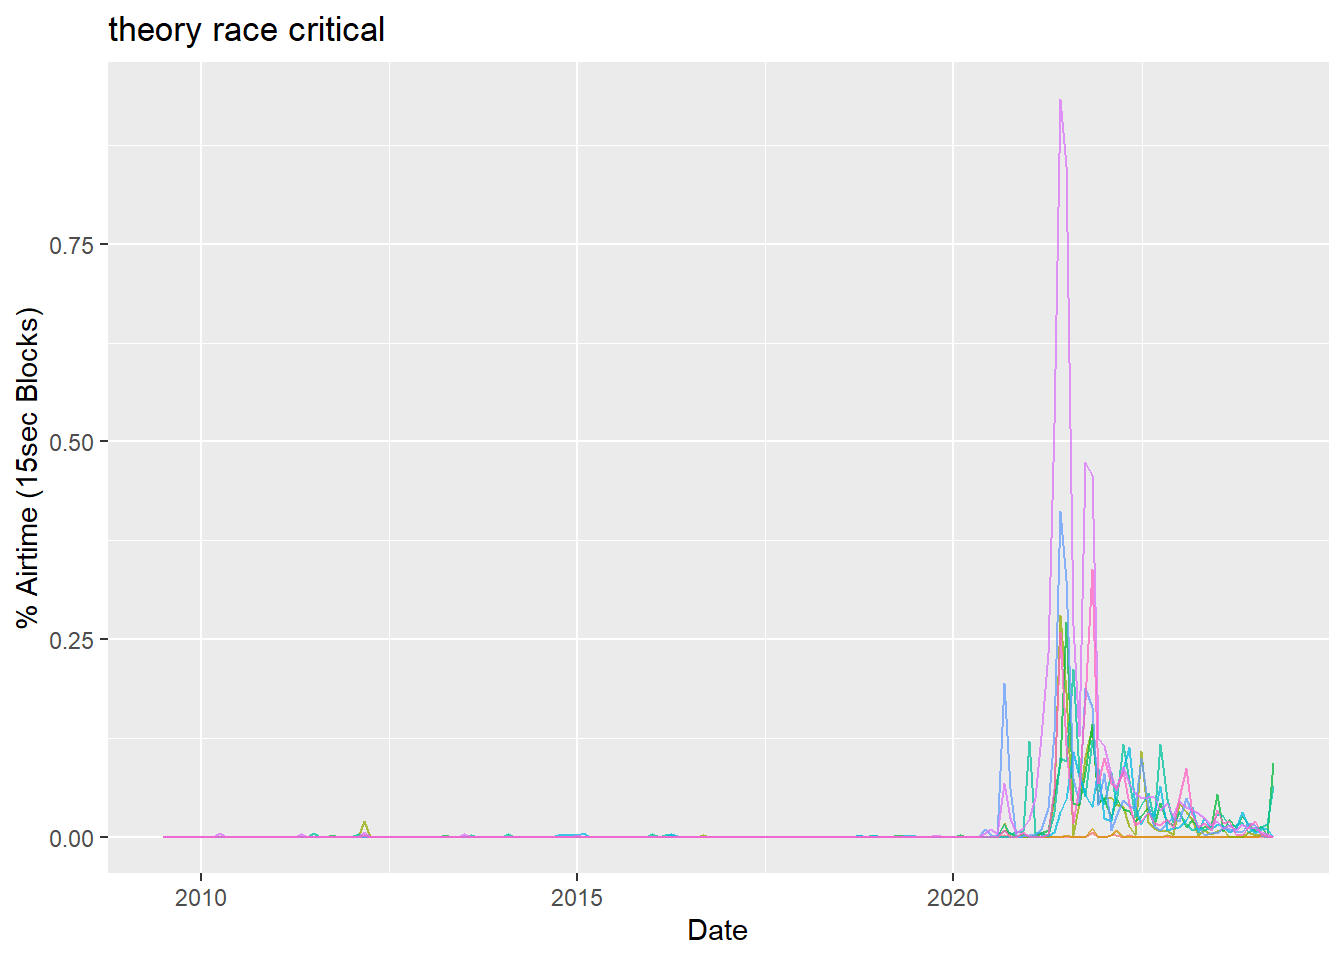
In the GDELT interface, if one wants to submit a multi-word search using AND operators the user simply enters a space delimited list of words (see note above). This returns a search composed of a series of words joined by AND Boolean operators. If one wants to search on an exact phrase, it is placed within quotes. It is possible to string together multiple exact phrases separated by spaces for an AND operator. It is super simple, but when working in R there is an issue to consider.
In R, when defining strings that need to contain quotation marks (""), which is the case with exact phrase searches of GDELT, it is important to use double quotes (i.e. '""'). Doing so will achieve the results of single quotes in the Explorer Search GUI. When working with query_tv, this very basic fact of R initially confused me and led to some unexpected results. I figured out the issue by generating some comparison graphs. In R, string variables must always be placed in quotes. Therefore, to get a string that contains quotes, one must use double quotes. This would be true regardless of what method one is using to communicate with an API.
# search terms used to make following graph
# note how the term is constructed noting the result
search_term1 <- 'critical race theory'
search_term2 <- '"critical race theory"'
search_term3 <- 'theory race critical'
search_term4 <- '"theory race critical"'
search_term5 <- '(critical OR race OR theory)'
search_term6 <- '"(critical OR race OR theory)"'
df1 <- query_tv(search_term1)
df2 <- query_tv(search_term2)
df3 <- query_tv(search_term3)
df4 <- query_tv(search_term4)
df5 <- query_tv(search_term5)
df6 <- query_tv(search_term6)
p1 <- df1 %>%
ggplot(aes(date, value, color=network))+
geom_line(alpha = 0.75)+
labs(title = search_term1,
color = "Network")+
xlab("Date")+
ylab("% Airtime (15sec Blocks)")+
theme(legend.position = "none")
p2 <- df2 %>%
ggplot(aes(date, value, color=network))+
geom_line(alpha = 0.75)+
labs(title = search_term2,
color = "Network")+
xlab("Date")+
ylab("% Airtime (15sec Blocks)")+
theme(legend.position = "none")
p3 <- df3 %>%
ggplot(aes(date, value, color=network))+
geom_line(alpha = 0.75)+
labs(title = search_term3,
color = "Network")+
xlab("Date")+
ylab("% Airtime (15sec Blocks)")+
theme(legend.position = "none")
p4 <- df4 %>%
ggplot(aes(date, value, color=network))+
geom_line(alpha = 0.75)+
labs(title = search_term4,
color = "Network")+
xlab("Date")+
ylab("% Airtime (15sec Blocks)")+
theme(legend.position = "none")
p5 <- df5 %>%
ggplot(aes(date, value, color=network))+
geom_line(alpha = 0.75)+
labs(title = search_term5,
color = "Network")+
xlab("Date")+
ylab("% Airtime (15sec Blocks)")+
theme(legend.position = "none")
p6 <- df6 %>%
ggplot(aes(date, value, color=network))+
geom_line(alpha = 0.75)+
labs(title = search_term6,
color = "Network")+
xlab("Date")+
ylab("% Airtime (15sec Blocks)")+
theme(legend.position = "none")
API Requests with httr
When launching out to try to understand how to access API’s via R, I quickly encountered pages that discussed the httr library. It seems to be a very common way of accessing API’s via R, and thus worth some mention. The library’s “Getting started with httr” page is the best place to start understanding how to use it. An R-bloggers post on “using the httr package to retrieve data from apis in R” is also very helpful.
I started out using httr before reasoning that I could simply use read_csv. There are some working httr examples below, I may be going about this wrong but most of them still end up relying on read_csv.
Request to GDELT using httr: table embedded in JSON
Using the GET() method it was possible to issue a request to GEDELT 2.0 TV and receive JSON data. If format is set to csv it will return CSV. To access the data, that response just goes back to read_csv. In this case, it is easier to simply pass the request URL directly to read_csv and get back a data frame.
res <- GET("https://api.gdeltproject.org/api/v2/tv/tv?format=csv×pan=FULL&last24=yes&dateres=DAY&query=%22critical%20race%20theory%22%20(station:BLOOMBERG%20OR%20station:CNBC%20OR%20station:CNN%20OR%20station:CSPAN%20OR%20station:CSPAN2%20OR%20station:CSPAN3%20OR%20station:FBC%20OR%20station:FOXNEWS%20OR%20station:MSNBC%20)%20&mode=timelinevol&timezoom=yes")
data <- rawToChar(res$content)
read_csv(data)Rows: 48762 Columns: 3
── Column specification ────────────────────────────────────────────────────────
Delimiter: ","
chr (1): Series
dbl (1): Value
date (1): Date (Daily +00:00: 06/05/2009 - 04/04/2024)
ℹ Use `spec()` to retrieve the full column specification for this data.
ℹ Specify the column types or set `show_col_types = FALSE` to quiet this message.# A tibble: 48,762 × 3
`Date (Daily +00:00: 06/05/2009 - 04/04/2024)` Series Value
<date> <chr> <dbl>
1 2009-06-05 BLOOMBERG 0
2 2009-06-06 BLOOMBERG 0
3 2009-06-07 BLOOMBERG 0
4 2009-06-08 BLOOMBERG 0
5 2009-06-09 BLOOMBERG 0
6 2009-06-10 BLOOMBERG 0
7 2009-06-11 BLOOMBERG 0
8 2009-06-12 BLOOMBERG 0
9 2009-06-13 BLOOMBERG 0
10 2009-06-14 BLOOMBERG 0
# ℹ 48,752 more rowsReferences
Citation
@online{craig2021,
  author = {Craig, Nathan},
  title = {GDELT {Summary} {Explorer} {API} {Calls} in {R}},
  date = {2021-12-09},
  url = {https://ncraig.netlify.app/posts/2021-12-09-gdelt-summary-explorer-api-calls-in-r/index.html},
  langid = {en}
}